Monitoring
Monitoring is a key aspect of everyday system administration. Through monitoring, administrators can obtain information about resource usage (cpu, memory, etc.) that allows them to better tune the solution and prevent potential issues. Besides monitoring basic resources, JOSSO 2 also provides usage statistics, like the number of user sessions an Identity Provider is handling, or the maximum number of simultaneous sessions registered for that same provider. Additionally administrators can also use modify server parameters, or even manage user sessions.
The tutorial introduces the different monitoring options available in JOSSO 2, and then it explains how to configure and effectively use them to keep track of the server health. It describes statistical information like system resources and user activity, and how to use this information to prevent performance issues or service outages.
Using Java Management Extension (JMX)
JOSSO 2 adheres to the Java standard for monitoring and management: Java Management Extension (JMX) which is widely adopted by management solutions (consoles, monitoring services, etc). This allows IT departments to leverage their existing monitoring infrastructure, by connecting any JMX client to JOSSO. JOSSO 2 provides a wide variety of Managed Beans (Mbeans) that allow you to fully monitor and administrate your JOSSO 2 servers.
Pre-requisites
Before starting with this section, make sure that the following prerequisites are fulfilled:
JMX Client (Java Console can be used)
JOSSO 2.4.0 or above
Running identity appliance (recommended)
Monitoring and Management System Settings
You can configure the JMX service on your JOSSO 2 server by opening Atricore Web console, and then accessing the Monitoring and Management option located in the System Settings section. These are the available settings, but you normally don’t need to change them as the default values will work on most environments.
| Field | Description |
| RMI Registry Port | The port number the JOSSO2 RMI Registry service will bind to. By default, JOSSO2 will bind to port 1099. |
| RMI Server Port | The port number the JOSSO2 RMI Server will bind to. By default, JOSSO2 will bind to port 44444. |
| Service URL | The service URL the JOSSO2 JMX Service will bind to. |
TIP
To bind the JMX service to an address other than localhost (127.0.0.1), you need to manually edit the Service URL located at: $JOSSO2_HOME/etc/org apache.karaf.management.cfg Only replace localhost with the server IP address, but keep the rest of the URL unmodified. Setting the bind address will be a console option in future versions.
Connecting to the JMX Service
You can connect any JMX client using the service URL provided by the Atricore console. You probably need to replace the host name with the JOSSO server name or IP address. For instance, if your JOSSO server is using IP 192.168.1.100, the JMX URL will look like:
service:jmx:rmi://localhost:44444/jndi/rmi://localhost:1099/karaf-josso-ee
The connection is secured using basic authentication, you can use any Administrator user registered in the default identity vault. When running a remote JMX client you need to open the proper TCP ports and bind the JMX service to a different address (the default is localhost).
TIP
You can manage Administrator user accounts with the Account and Entitlement Management feature that is available in the Atricore Web Console. The default Administrator credentials are: admin for username and atricore for password, but you can use any user account that is associated with the Administrator group.
Monitoring JVM Resources
The most critical JVM resources are CPU utilization and memory usage. Through JMX you can keep track of both resources, and depending on your management infrastructure, you can define alert policies to detect when the resources reach a critical value.
CPU utilization
This normally depends on load. You want a safety margin allowing JOSSO to handle traffic peaks therefore the average utilization should not go over 40%. You may need to add additional nodes, or increase your VM specs (when using virtualization) if your average CPU utilization is too high.
The other aspect to keep in mind is that when memory is running low, the JVM will consume a lot of CPU resources during garbage collection. If the garbage collector is using more that 10% of the total used CPU, you may want to consider increasing the available memory for JOSSO, specifically the memory heap size.
The JMX support provides a way to keep track of CPU utilization, as shown in the graphic below. You can use any JMX tool to monitor CPU utilization, as well as the the Java Console (jconsole), or the Java Visual VM (jvisualvm) bundled with the JDK.
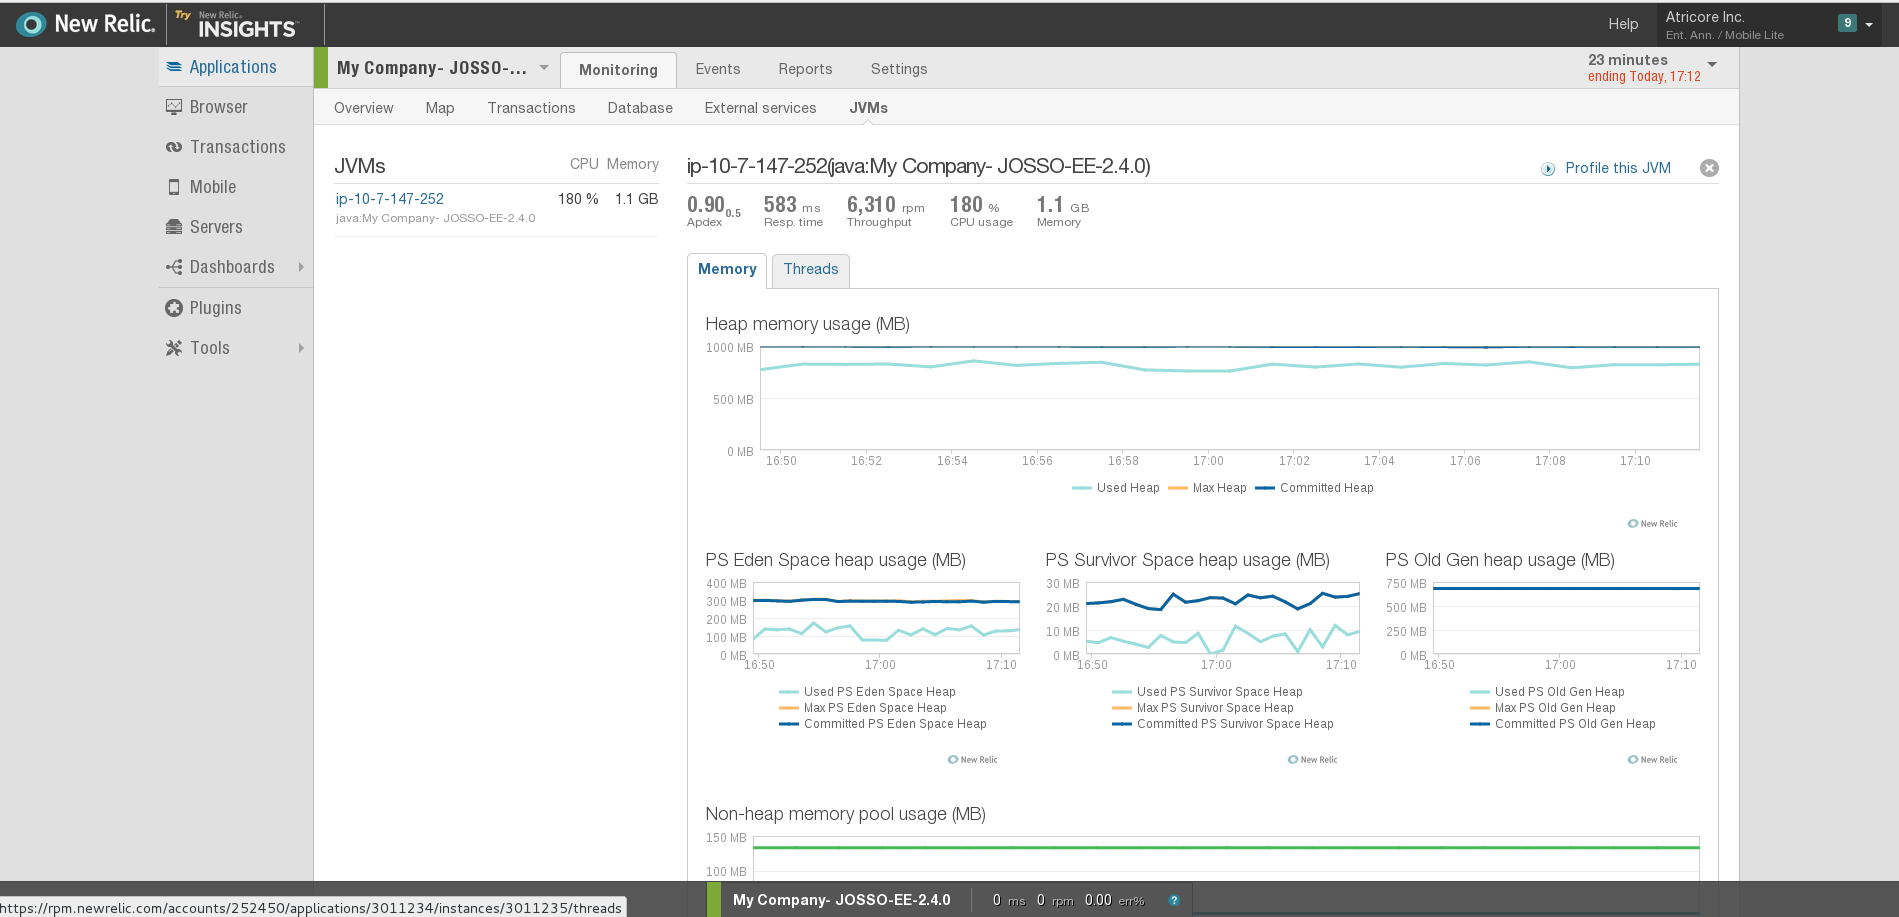
Memory usage
JVM memory is divided in heap and non-heap memory. The most critical value, and the one that you may need to update based on your needs, is the heap memory. JOSSO is by default configured to use 1Gb of system memory as heap, but this value can be increased if necessary. The maximum value depends on the platform, but normally 1Gb is enough for most deployments, configuring heap size larger than 8Gb may produce additional garbabe collector CPU utilization due to the fact that the managed memory size is too large. A proper heap memory configuration should ensure that, on average, 70% or less of the available heap is used.
You can monitor memory usage with any JMX tool, the Java Console (jconsole), or the Java Visual VM (jvisualvm).
JVM Threads
JVM threads can also be monitored using any JMX tool. The number of live threads, and the threads peak will depend on your system load. Most threads are created to handle user HTTP connections to the server, and you can monitor both values using JMX. A thread pool is kept to improve performance, therefore normally the number of threads will not go much lower that 400.
Managed Beans
Managed Beans (MBeans) are Java components that represent manageable resources. There are multiple MBeans availabe in JOSSO 2; some MBeans are provided by the JVM or the infrastructure included in the product, but others are JOSSO specific and allow administrators to monitor and manage user activity. MBeans are organized in namespaces, JOSSO 2 will automatically configure Identity Appliance MBeans using the appliance namespace and name using the pattern below:
<appliance-namespace>.<appliance-name>.idau
For instance, if your Identity Appliance namespace is com.atricore.qa and the appliance name is ida1 , all Appliance specific MBeans will be available under the namespace com.atricore.qa.ida1.idau as shown in the following image. MBean type will depend on the managed identity component, all Identity Providers will be grouped as IdentityProvider MBeans.
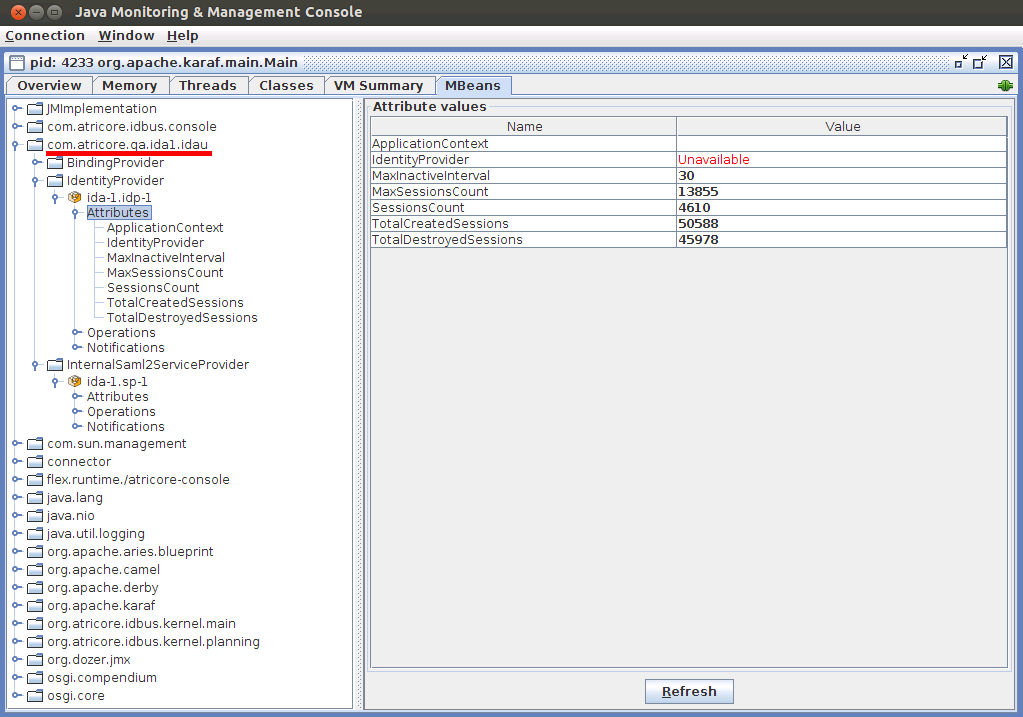
Identity Provider MBean
Attribute values are initialized every time the Identity Appliance is started.
| Attribute | Description |
| SessionCount | Number of live sessions |
| MaxSessionCount | Max Number of live sessions |
| TotalCreatedSessions | Number of user sign-ins |
| TotalDestroyedSessions | Number of sign-outs either due to session timeout or user log-out. |
| MaxInactiveInterval | SSO Session timeout in minutes, can be updated but will be restored to the configured value if the appliance is restarted. |
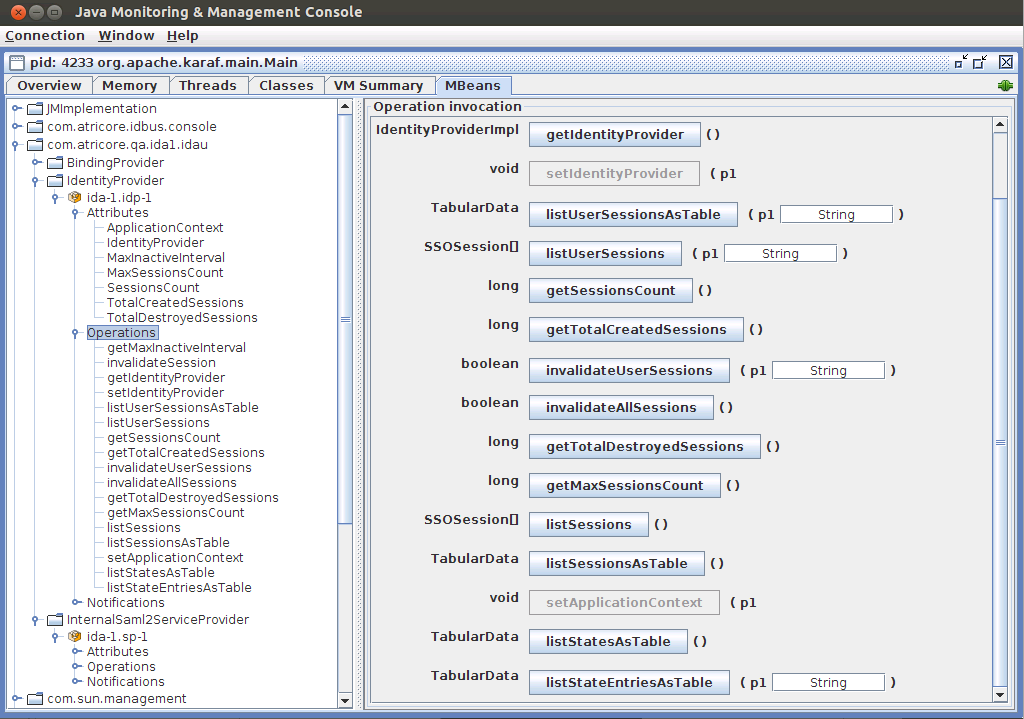
Operations can be used to obtain information about user activity, and also to manage user sessions. Some operations are intended for internal use, this is the list of relevant methods. These operations only apply to the current IdP. They will not affect other IdPs either in the same Identity Appliance or in different Appliances.
| Operation | Arguments | Description |
| invalidateAllSessions | None | Termimate all SSO sessions, all users will be logged out |
| invalidateUserSessions | String: username | Terminate all SSO sessions associated to the user |
| invalidateSession | String: session identifier | Terminate the SSO session associated to the given identifier |
| listUserSessions | None | List all SSO sessions, provides information about creation time, last accessed time, username. (This may cause performance issues) |
| listSessionsAsTable | None | List all SSO sessions, provides information about creation time, last accessed time, username. |
| listUserSessionsAsTable | String: username | List user specific SSO sessions, provides information about creation time, last accessed time, username. |
JMX Tools
Java Visual VM tool
This tool is bundled with the Java Development Kit since version 6. It allows you to monitor any JVM process. This is the overview screen for a JOSSO 2 server under load testing.

Java Console tool
The Java Management Console is also provided with the JDK and it can be used to both monitor resources and to access Managed Bean components, a feature that the Java Visual VM does not support.
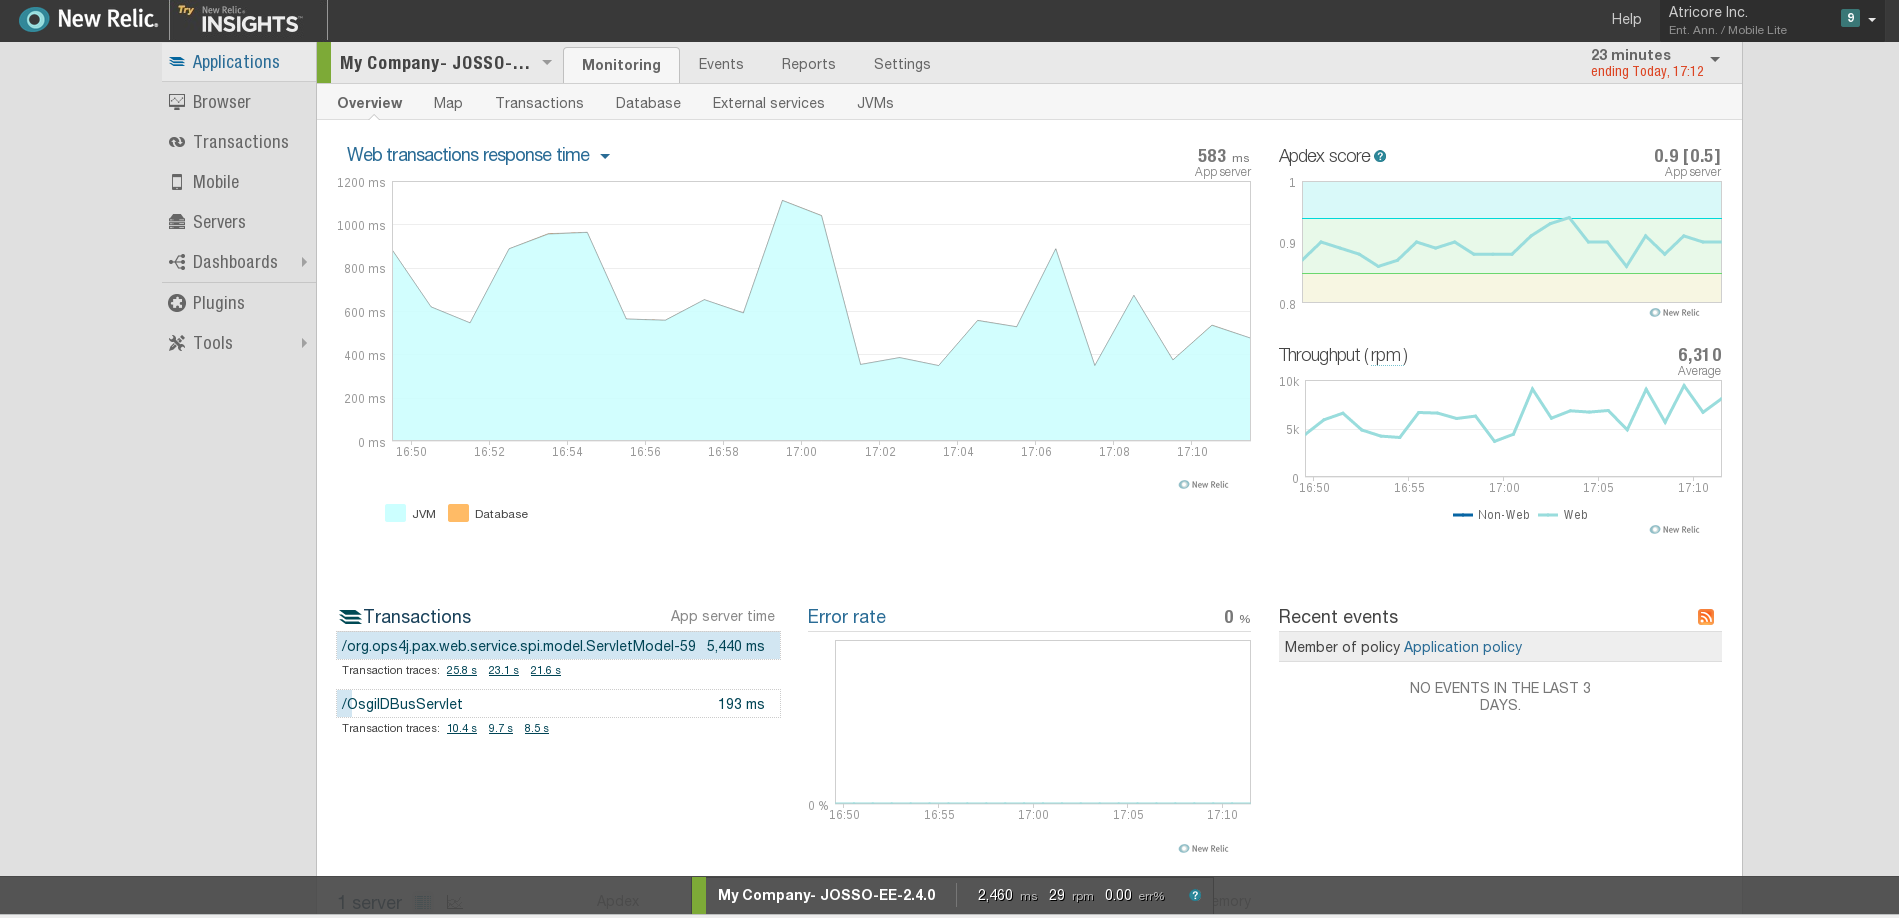
Remote Monitoring
Atricore also provides remote motoring for your JOSSO deployments. This managed monitoring service allows Atricore to keep track of system resources, performance, user satisfaction (Apdex index) and sso statistics remotely, using a cloud-based system. The system will also monitor problems that require immediate attention, such as those that can affect service availability, so that they can be addressed quickly to avoid system outages. The service requires that your JOSSO server can connect to the Internet in order to push the required information. HTTP proxies are supported, you can specify the host and port in your monitoring agent configuration file.
Activating Managed Monitoring
In order to activate JOSSO Managed monitoring, you need the following prerequisites:
Managed monitoring agent
Managed monitoring configuration
The service is based on NewRelic, which the installation of a specific set of components.
Download and Install JOSSO NewRelic Agent
The agent distribution contains all necessary binary files and changes to JOSSO 2 configuration. Once istalled, the built-in monitoring component will be replaced with the NewRelic monitoring implementation. In order to activate it, the proper JOSSO 2 feature will be activated.
TIP
Installing the agent will override your JOSSO 2 features configuration file, make sure to create a back-up if you made any changes to it, or to disable NewRelic in the future. $JOSSO2_HOME/etc/org.apache.karaf.features.cfg
Get the latest newrelic agent and simply extract the files into JOSSO 2 Home folder, for example:
| JOSSO Version | Newrelic Agent |
| 2.4.0 | 2.21.4 |
| 2.4.1-SNAPSHOT | 3.17.0 |
$ cd /opt/atricore/josso2-ee-2.4.0
$ tar zvxf ~/Downloads/josso-ee-2.4.0-newrelic-2.21.4.tar.gz
etc/
etc/org.apache.karaf.features.cfg
newrelic/
newrelic/newrelic-api.jar
newrelic/logs/
newrelic/logs/newrelic_agent.log
newrelic/CHANGELOG
newrelic/extension-example.xml
newrelic/extension.xsd
newrelic/nrcerts
newrelic/LICENSE
newrelic/newrelic.jar
newrelic/README.txt
system/
system/com/
system/com/atricore/
system/com/atricore/idbus/
system/com/atricore/idbus/monitoring/
system/com/atricore/idbus/monitoring/com.atricore.idbus.monitoring.newrelic/
system/com/atricore/idbus/monitoring/com.atricore.idbus.monitoring.newrelic/1.4.0/
system/com/atricore/idbus/monitoring/com.atricore.idbus.monitoring.newrelic/1.4.0/com.atricore.idbus.monitoring.newrelic-1.4.0.jar
system/com/atricore/enterprise/
system/com/atricore/enterprise/bundles/
system/com/atricore/enterprise/bundles/com.atricore.enterprise.bundles.newrelic-api-v2_13/
system/com/atricore/enterprise/bundles/com.atricore.enterprise.bundles.newrelic-api-v2_13/1.4.0/
system/com/atricore/enterprise/bundles/com.atricore.enterprise.bundles.newrelic-api-v2_13/1.4.0/com.atricore.enterprise.bundles.newrelic-api-v2_13-1.4.0.jar
Configure JOSSO NewRelic Agent Configuration
Now that you have installed the agent, copy the configuration file provided by Atricore or NewRelic (newrelic.yml) support into $JOSSO2_HOME/newrelic folder. The file will contain specific information about your server and support account. If a proxy is required for connecting to the New Relic server, you need to set the proxy settings by editing this file. Only proxy_host is required. The username and password settings will be used to authenticate to Basic Auth challenges from a proxy server.
| Property | Description |
| proxy_host | HTTP proxy hostname or IP address |
| proxy_port | HTTP proxy TCP port, default value 8080 |
| proxy_user | username |
| proxy_password | password |
Enable JOSSO Monitoring support
In order to enable the JOSSO 2 Monitoring support, you need to modify the features that are started upon boot. Edit the file $JOSSO2_HOME/etc/org.apache.karaf.features and modify the featuresBoot property:
featuresBoot=atricore-branding,config,ssh,management,spring,spring-dm,atricore-monitoring-builtin,atricore-auditing-builtin,josso-ee
with this one (notice that atricore-monitoring-builtin has been replaced with josso-ee-monitoring-newrelic )
featuresBoot=atricore-branding,config,ssh,management,spring,spring-dm,josso-ee-monitoring-newrelic,atricore-auditing-builtin,josso-ee
Then you need to define the IDBUS_MONITORING environment variable. You can edit JOSSO’s startup script, and add the variable declaration at the beginning of the file:
$JOSSO2_HOME/bin/atricore
#!/bin/sh
..
#
DIRNAME=`dirname $0`
PROGNAME=`basename $0`
IDBUS_MONITORING=true
Early 2.4.1 Versions
Some 2.4.1 versions require that you also modify the $JOSSO2_HOME/bin/atricore or %JOSSO2_HOME%\bin\atricore.bat files. Look for the following
atricore : make sure that the mkdir lines for the tmp folder are present.
 cleanUp() {
     rm -rf $KARAF_BASE/data/activemq-idbus
     rm -rf $KARAF_BASE/data/tmp/
     mkdir -p $KARAF_BASE/data/tmp

     # Clear persistent state
     rm -rf $KARAF_BASE/data/ehcache

     # Clear bundles cache
     rm -rf $KARAF_BASE/data/cache
 }

 cleanUpFast() {
     rm -rf $KARAF_BASE/data/activemq-idbus
     rm -rf $KARAF_BASE/data/tmp
     mkdir -p $KARAF_BASE/data/tmp
 }
atricore.bat : make sure that the mkdir line for the tmp folder is there.
 :RUN

    rem Clean up state from previous runs
    rmdir /S /Q %KARAF_BASE%\data\activemq-idbus 2> nul
    rmdir /S /Q %KARAF_BASE%\data\tmp\ 2> nul
    rmdir /S /Q %KARAF_BASE%\data\ehcache\ 2> nul
    rmdir /S /Q %KARAF_BASE%\data\cache\ 2> nul
    mkdir %KARAF_BASE%\data\tmp\ 2> nul
Restart JOSSO
Now you’re ready to restart JOSSO, you can verify that JOSSO NewRelic agent is working properly by looking to the agent log file. The application name will
$JOSSO2_HOME/newrelic/logs/newrelic_agent.log
Jan 1, 2014 15:47:06 -0400 NewRelic 64 INFO: Initializing Jetty system sampler
Jan 1, 2014 15:47:07 -0400 NewRelic 22 INFO: Initializing Jetty system sampler
Jan 1, 2014 15:47:08 -0400 NewRelic 51 INFO: Server Info: jetty/6.1.x
Jan 1, 2014 15:48:58 -0400 NewRelic 9 INFO: Collector redirection to collector-139.newrelic.com:443
Jan 1, 2014 15:48:59 -0400 NewRelic 9 INFO: Agent run id: 719958508
Jan 1, 2014 15:48:59 -0400 NewRelic 9 INFO: Agent 8473@localhost.localdomain/My Company connected to collector.newrelic.com.:443
Jan 1, 2014 15:48:59 -0400 NewRelic 9 INFO: Real user monitoring is enabled with auto instrumentation for application "My Company"
Jan 1, 2014 15:48:59 -0400 NewRelic 9 INFO: Errors will be sent to New Relic for My Company
TIP
Please confirm with Atricore support that your server is visible in the monitoring infrastructure. The assistance of an Atricore engineer during the install process is also recommended.
Reporting
Atricore will periodically provide statistical reports about the overall system performance, resource usage, user satisfaction indexes and processed alerts.